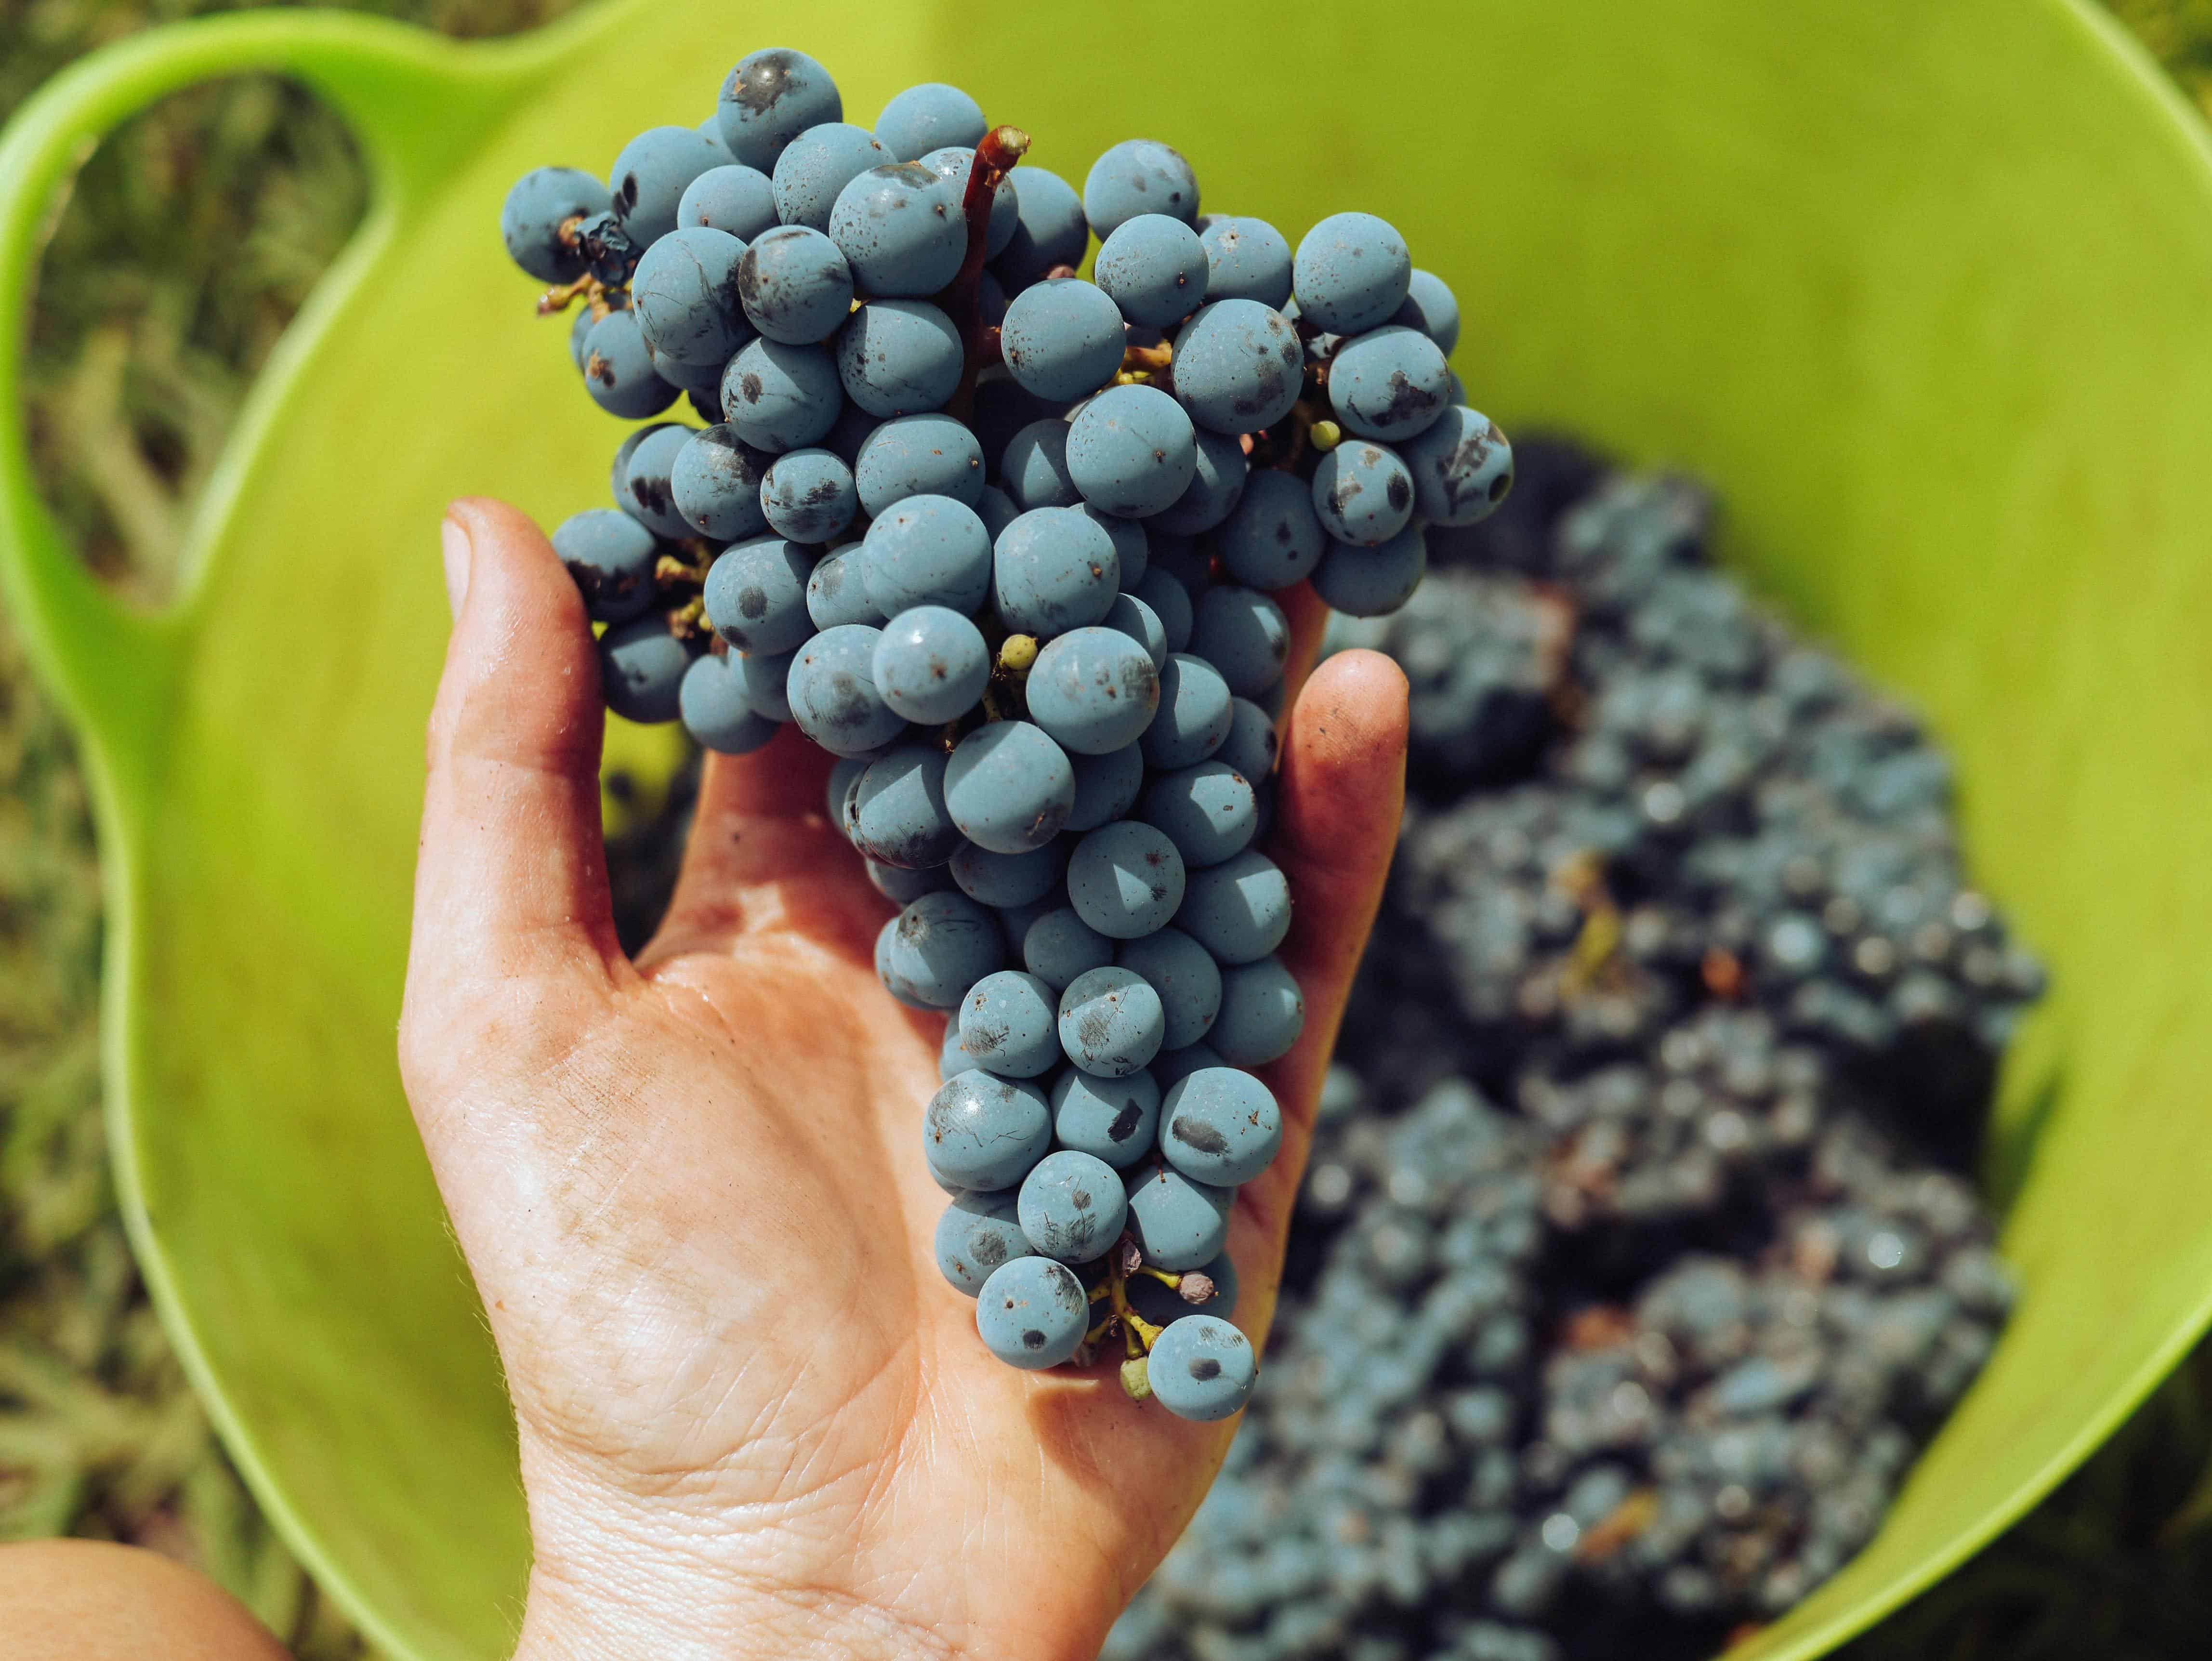
In a climate change environment, every harvest presents a new challenge for winemakers. One of their main concerns is achieving the desired equilibrium of sugars and acids while maximizing the phenolic potential in the grapes.
- About
- Solutions
-
![arrow]() Clinical Analysis
Clinical Analysis
-
![arrow]() Biochemistry Systems
Biochemistry Systems
-
![arrow]() If you are interested in our solutions for Clinical Analysis, you can learn more on our Global website and reach out to us with your needs.
Visit our Global Website
If you are interested in our solutions for Clinical Analysis, you can learn more on our Global website and reach out to us with your needs.
Visit our Global Website![arrow]()
-
![arrow]() Autoimmunity Systems
Autoimmunity Systems
-
![arrow]() If you are interested in our solutions for Clinical Analysis, you can learn more on our Global website and reach out to us with your needs.
Visit our Global Website
If you are interested in our solutions for Clinical Analysis, you can learn more on our Global website and reach out to us with your needs.
Visit our Global Website![arrow]()
-
-
![arrow]() Veterinary Analysis
Veterinary Analysis
-
![arrow]() Biochemistry Systems
Biochemistry Systems
-
![arrow]() If you are interested in our solutions for Clinical Analysis, you can learn more on our Global website and reach out to us with your needs.
Visit our Global Website
If you are interested in our solutions for Clinical Analysis, you can learn more on our Global website and reach out to us with your needs.
Visit our Global Website![arrow]()
-
![arrow]() Vector-borne Diseases Systems
Vector-borne Diseases Systems
-
![arrow]() If you are interested in our solutions for Clinical Analysis, you can learn more on our Global website and reach out to us with your needs.
Visit our Global Website
If you are interested in our solutions for Clinical Analysis, you can learn more on our Global website and reach out to us with your needs.
Visit our Global Website![arrow]()
-
-
![arrow]() Food & Beverage Analysis
Food & Beverage Analysis
-
![arrow]() Environmental Analysis
Environmental Analysis
-
![arrow]() Bioprocess Analysis
Bioprocess Analysis
-
- Discover
- Contact
- Resources

All rights reserved.
©2026

1.thigh.jpg "Y15")